TycheHowTo:CreateAFinanceDecoderStory

Introduction
The purpose of this document is to create a data story using a Strong Towns Finance Decoder as an input.
At Tyche Insights we like the Finance Decoder as a tool to assess your local government's financial health. As Strong Towns notes, the Finance Decoder can help anyone "Understand whether your city is on track to keep its development, service, and growth promises."
This article assumes that you have already created a Finance Decoder for your city (or town, village, county, etc). Tyche Insights is a supporter of the Hudson Finance Decoder Project if you haven't created a Finance Decoder and need assistance. We have also written this article for more guidance.
Once you have completed your Finance Decoder you will want to share your results with Strong Towns, see the "Share your results" button on the Strong Towns website.
We also want people to share their Finance Decoder as another way to explain what you did, to provide more depth on your findings and to make your Finance Decoder available to anyone who is searching Tyche Insights for stories about your community. Put another way - you've done all of this great work to create a Finance Decoder, let's find additional ways to push your findings out into the world.
Illustrative Example
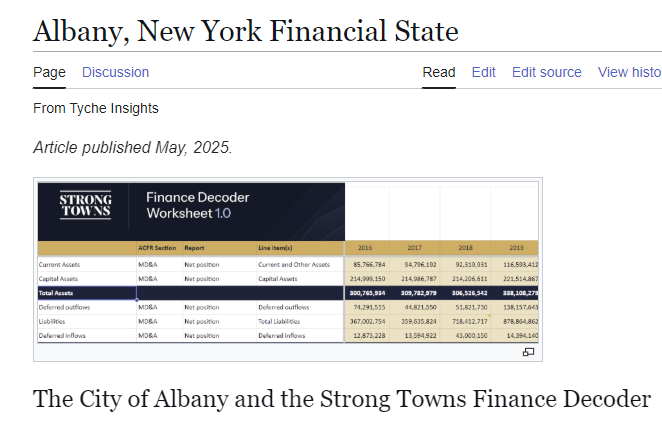
After we created a Finance Decoder for the City of Albany, NY we wrote this article. The structure of the article is:
- an explanation of the Strong Towns Finance Decoder
- a link to the Finance Decoder Google Sheet
- an important explanation of the GASB accounting standard and how it impacted the City's results
- an explanation of each of the 7 metrics and their associated graphs
- an explanation of which components of the City that we studied - we evaluated the Primary government and not the Component units
- a description of the process that we used, which allows anyone to recreate our work, or extend our work in future years
Writing a data story around the Finance Decoder could allow you to add additional commentary on adverse findings that the auditor found, a description of any remarkable year-over year changes in the finances, and/or comments on future explorations based on your findings. For example, government debt is a hot topic; a Finance Decoder exploration might point to follow-on analysis looking at debt. You may also remark on any obstacles that you faced - the need to FOIL or make public information requests to get the documents, audited financial statements that were non-standard, issues where you needed to make a judgment call, etc.
Creating a Data Story from a Finance Decoder
The process for creating a data story from a completed Finance Decoder is relatively straightforward.
- Create a new page for your story - we recommend that you create a page that follows the convention <area name>_Financial_State.
- From your Google Sheet, take screenshots of each graph (Net Financial Position, Net Debt-to-Total Revenues, etc) and name each image in an easy-to-recognize manner, e.g. Tulsa_OK_FD_NetFinancialPosition.
- You can either write content from scratch or you can take the Albany NY Finance Decoder content, select and copy the content, and then paste it into your story. While this may require some cleanup (don't include Albany comments on a Tulsa Finance Decoder!) it can give you a good starting point for your article.
- Upload your screenshots in an appropriate place, alongside each block of content explaining a metric.
- When you add Categories: to your document, add the geographic area and add the category "StrongTowns FinanceDecoder" so that your article appears here.
We are undoubtedly missing a few tips and tricks that we will add over time that will assist in turning a Finance Decoder into a Tyche Insights data story. Similarly, we will also find that Finance Decoder-based stories will include interesting commentary that others may consider duplicating.