TycheHowTo:CreateValuePerAcreMap
The purpose of this document is to show an example of using QGIS geospatial software to create a Value per acre map.
QGIS is a very powerful open source desktop geospatial software. In this demo I’m using QGIS 3.34.9. QGIS can be downloaded and installed from https://qgis.org/download/.
How to create a Value per Acre Map
One way to examine the utilization and value of the land use in your community is to create a Value per Acre analysis.
Strong Towns has included value per acre analysis in a piece that they wrote about Kansas City, scroll down to see the "Value Per Acre" map. Additional introductory documents can be found here and here. Another how-to video can be found here using ArcGIS.
Sample Data
In this example we will use sample data for the City of Albany, NY - a .zip file of parcel data.
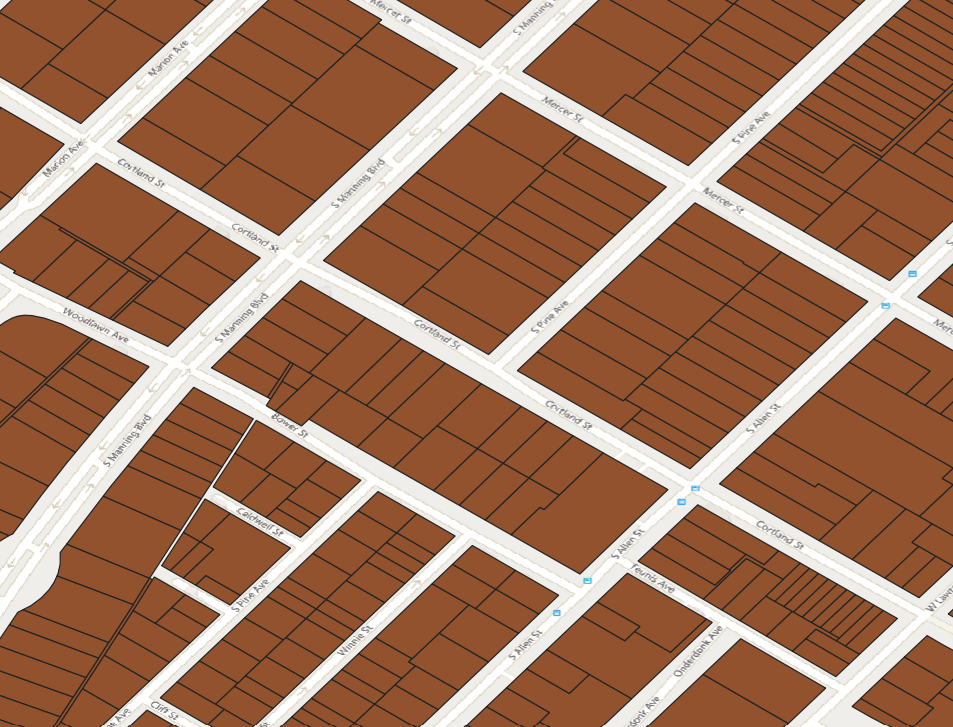
The .zip file contains X parcel boundaries for the City, in Esri SHP format with a file name of CityOfAlbany_Parcels.shp. Notice in the image below that the parcel boundaries do not extend into the street (the right of way).
Our process will be:
- combine all adjacent parcels together into "blocks"
- sum up the total assessed value for all properties on each block
- determine the acreage for each block
- create a total assessed value per acre statistic for each block
CityOfAlbany_Parcels.shp contains 29,423 parcel boundaries and, for each row, several fields associated with the property's value. LAND_AV is the assessed value of the property's land, TOTAL_AV is the assessed value of the property's land + improvements, FULL_MARKE is the full market value of the property.

Creating Blocks
We are using QGIS version 3.34.9 for this demonstration.
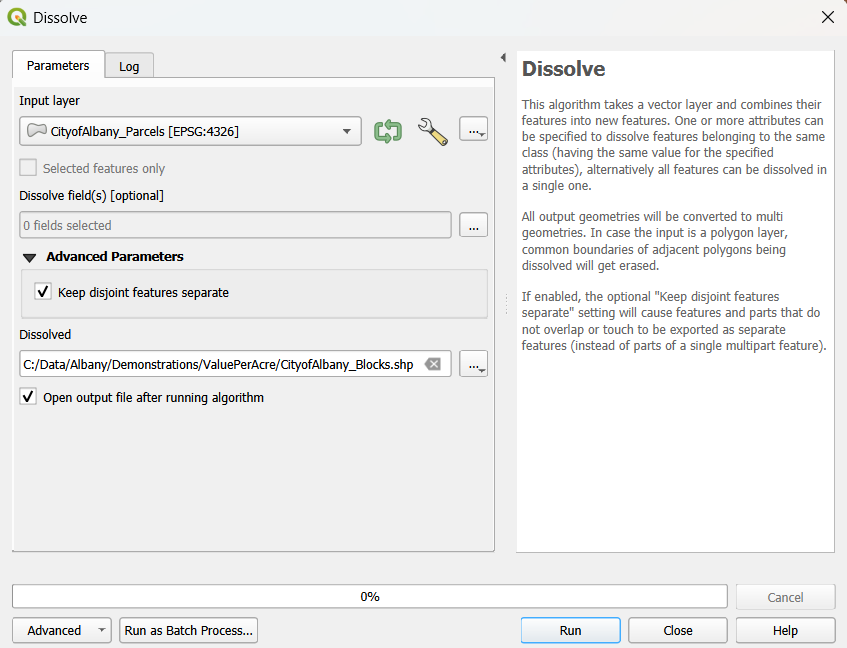
Open CityOfAlbany_Parcels.shp into a new QGIS Project. Our first step will be to create the "Blocks" that will look very similar to city blocks. We will use the QGIS Dissolve functionality found under Vector > Geoprocessing Tools > Dissolve.
Setting up the Dissolve process:
- Input layer = CityofAlbany_Parcels
- Output, or "Dissolved" layer = CityofAlbany_Blocks.shp (we save the output data to the same directory as the input data)
- Parameters -
- check "Keep disjoint features separate", this will ensure that each block will be its own output object rather than one multipolygon object within the output layer
- check "Open output file..." so you can immediately look at the layer
The process runs quickly and you can stylize the CityofAlbany_Blocks and display the blocks on top of th eparcels. You'll notice one object per block. Note that if the parcel boundaries don't have exact topological correctness (adjacency) then you may see small splinters or fragments of digitzed objects. These will not impact the analysis, generally.
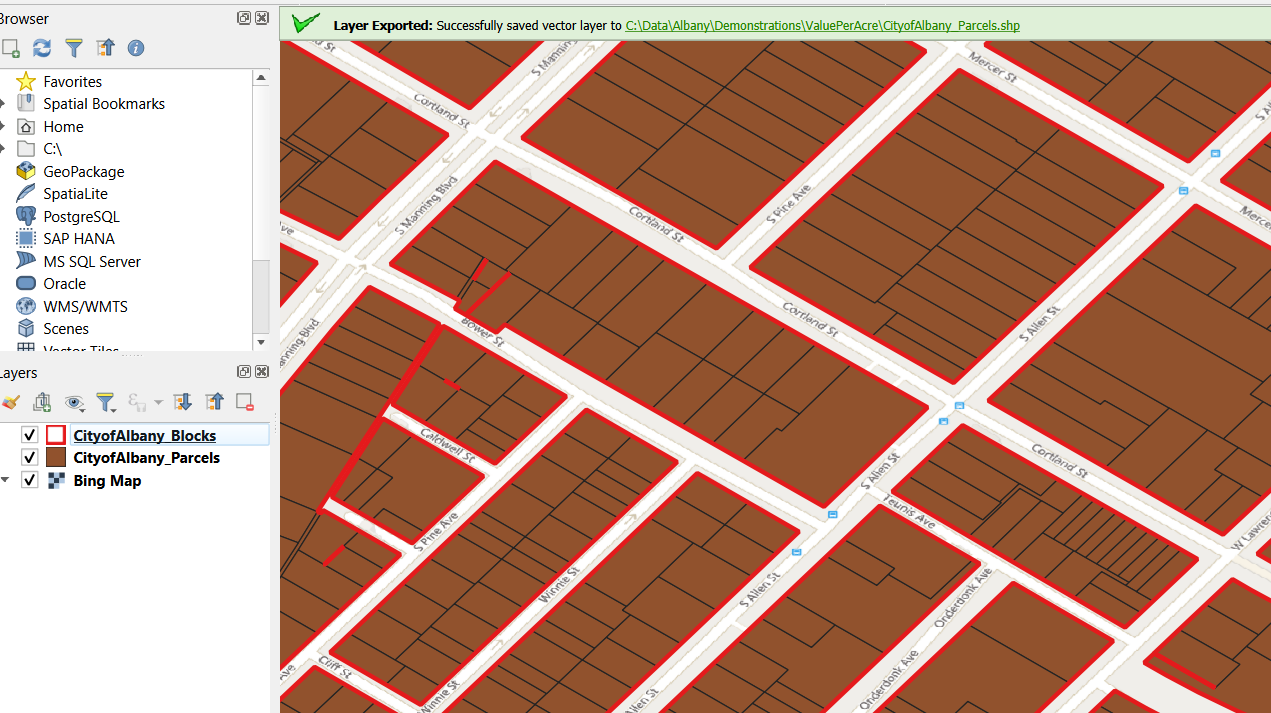
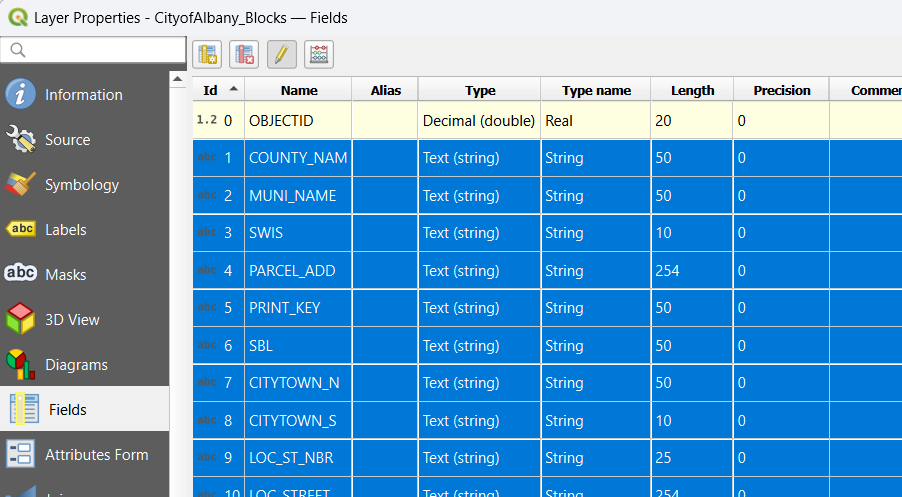
The attribute informtion for CityofAlbany_Blocks is somewhat nonsensical when you perform a dissolve so we need to do some cleanup.

Go into Properties for the layer, select all fields except for the OBJECTID field and delete the fields. Then add two new fields:
- AreaAcres - Decimanl Doulbe (10,3)
- TotValAcres - Integer (64 bit)
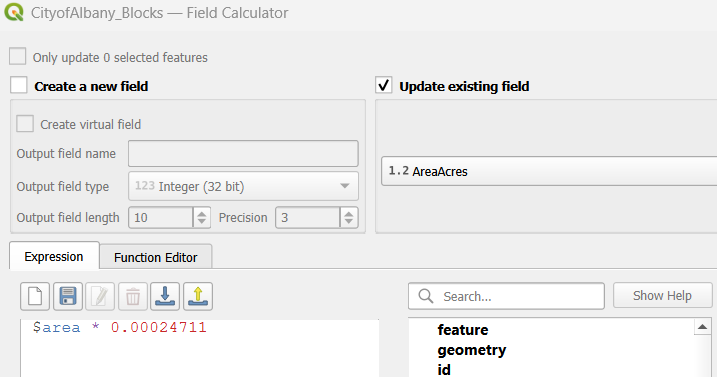
After you have delected and added fields, open up the Field Calculator and change the value of the RowID column to be equal to @row_number.

Using the Field Calculator to update the AreaAcres field with the value for number of acres in each polygon or region object. We use the formula $area (which returns the area in the default units which are square meters) * the number of acres per square meter.
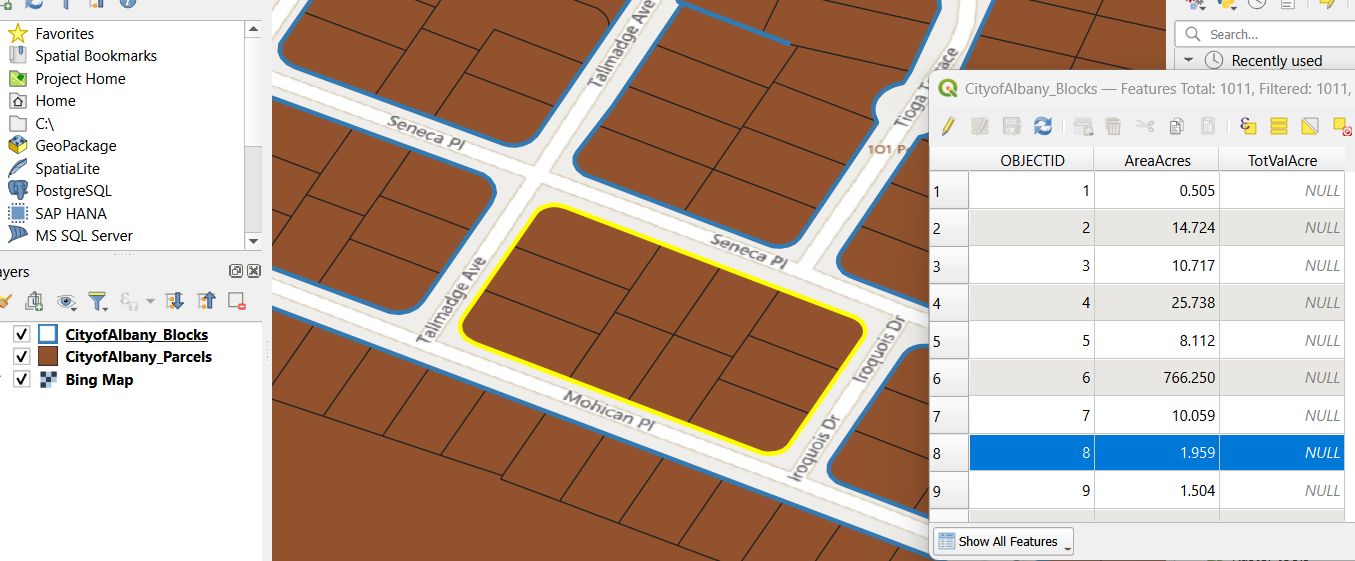
We can visualize our work up to this point. We have the blocks layer on top of the parcels layer, we have two additional fields for the area of the objects in acres, and a blank field to catch the final Value per acres calculation.
Computing Value Per Acre
In our next step we are going to join our Blocks with our Parcels layers and aggregate various values found in the Parcels layer based on the Blocks. For example, if there are 3 Parcels within a Block and the Parcels have TOTAL_AV values of $100,000, $150,000 and $200,000 then the Block should have an aggregate TOTAL_AV = $450,000.
We will use "Join Attributes by Location (Summary)" which is found under Processing > Toolbox.
Setting up the Join Attributes by Location process:
- "Join to Features in" layer = CityofAlbany_Blocks
- "By comparing to" layer = CityofAlbany_Parcels
- Fields to summarize = LAND_AV, TOTAL_AV, FULL_MARK. While we only use TOTAL_AV for this demonstration it could be helpful to analyze the Blocks by other summations.
- Output layer = CityofAlbany_BlocksWithSummaryData.shp
- Summaries to calculate = count, sum
- Parameters:
- the spatial operator to join the layers together is "intersect"
- Open output file after running algorithm
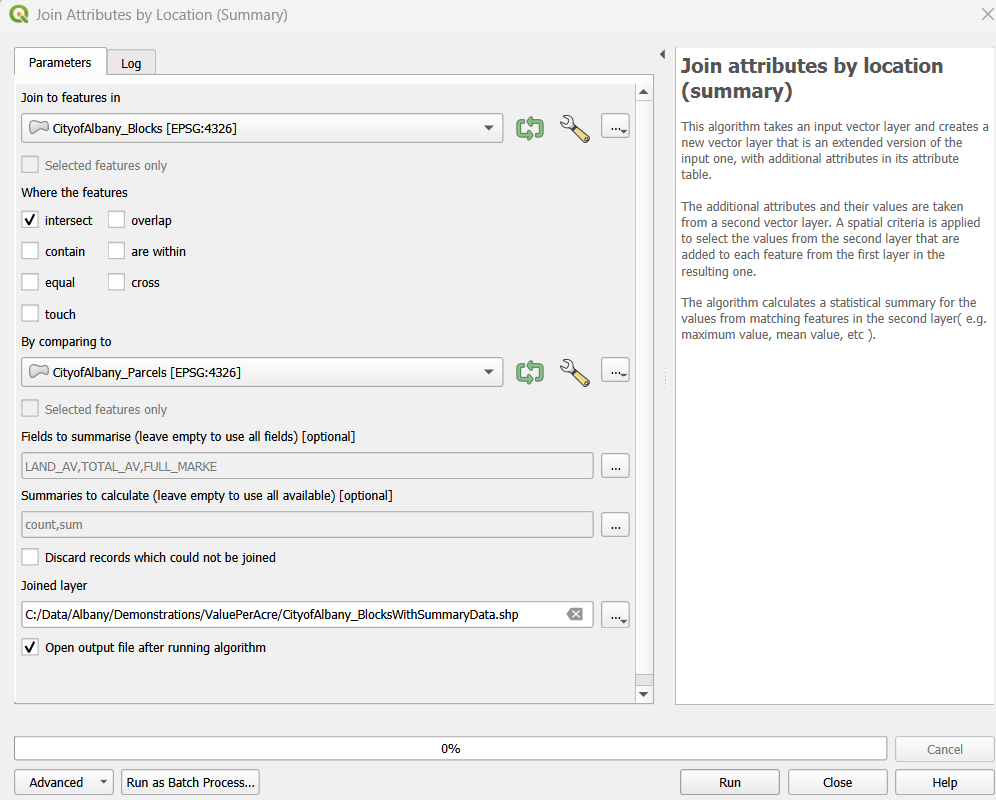
After running the Join Attributes by Location operation you will note that your output, CityofAlbany_BlocksWithSummaryData, will have count and summary data for LAND_AV, TOTAL_AV, FULL_MARK. You have enough information to creat the Value per acre field. Open the Field Calculator and update the field TotValAcre with TOTAL_AV_S / AreaAcres.
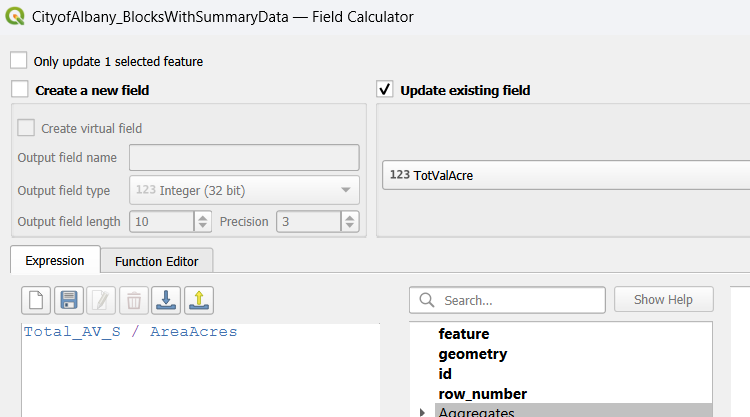
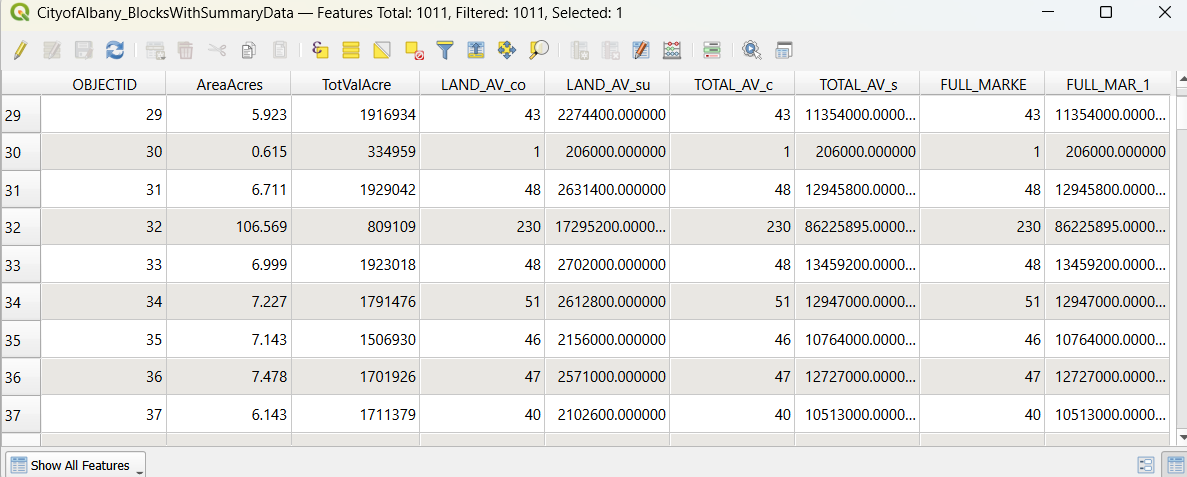
You will see that the attribute table now contains the total value per acre analysis, TotValAcr.
Visualizing Value per Acre analysis
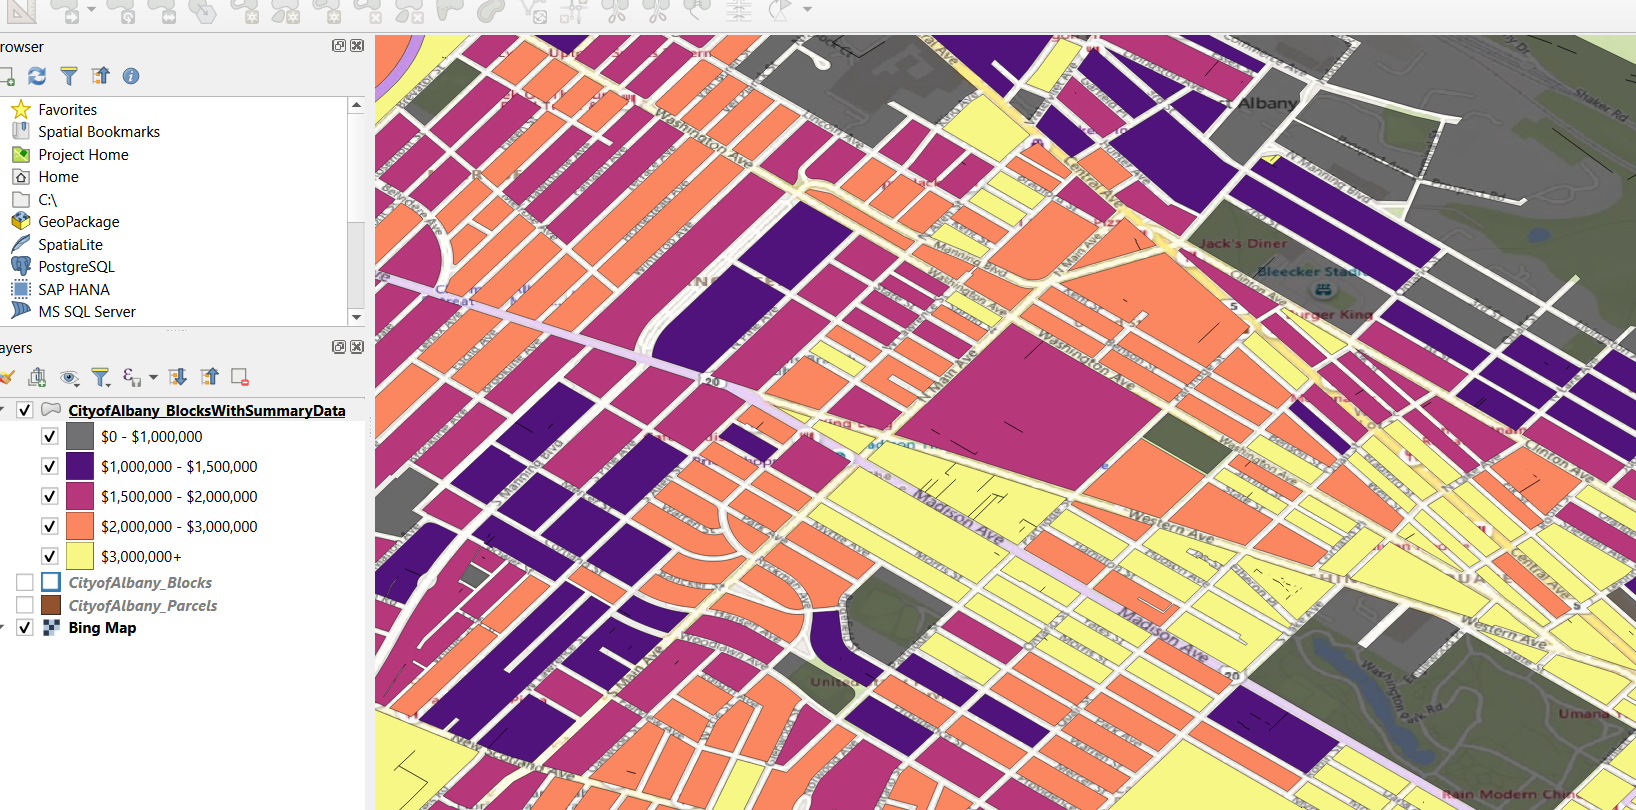
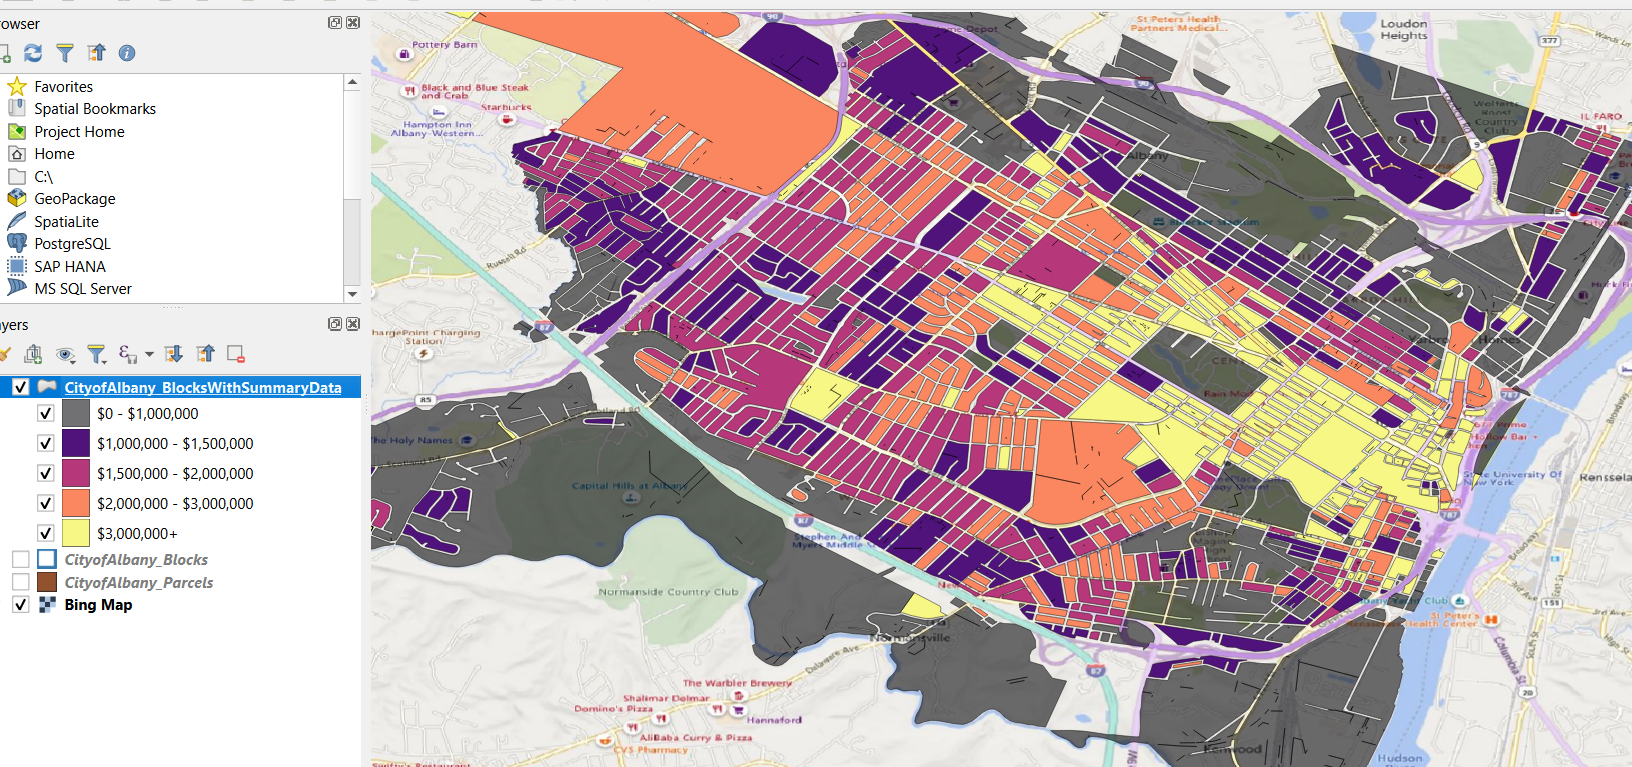
Now you can visualize the total value per acre analysis using the TotValAcr field. In this example, we are using a Graduated thematic map with 5 bins or classes, we are using break points that line up with million dollar and half million dollar breaks.
