TycheHowTo:CreateHeatMap
The purpose of this document is to show an example of using QGIS geospatial software to create a heatmap. A heatmap is a powerful visualization that rasterizes and colors a surface based on the density of a thing. We will use the Albany NY crime data for this example which can be downloaded by following the link below. We want to see where crimes are most happening so the heatmap should tease out (with brighter colors and/or more opaque coloring) where the crime hotspots are. File:CrimesWithXY ForVisualization.csv Sample data - Albany crimes for download
QGIS is a very powerful open source desktop geospatial software. In this demo I’m using QGIS 3.34.9. QGIS can be downloaded and installed from https://qgis.org/download/.
In this demo we will use a file of Albany crimes. This csv file has very basic data - x, y, and crime. It is unfiltered, it has all crimes where we are able to locate the crime (i.e. no (0,0) locations)
After you install QGIS you’ll want to install a handy plugin called QuickMapServices which will let you display background basedmaps showing streets and satellite imagery.
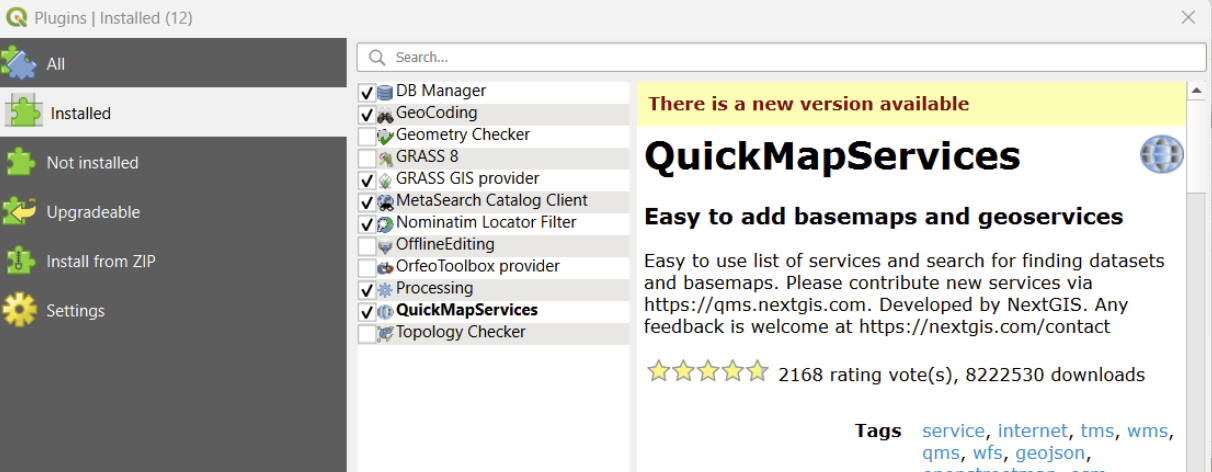
- Go to Plugins>Install & Manage
- Select “QuickMapServices” and install it - after which you’ll see it under “Installed”
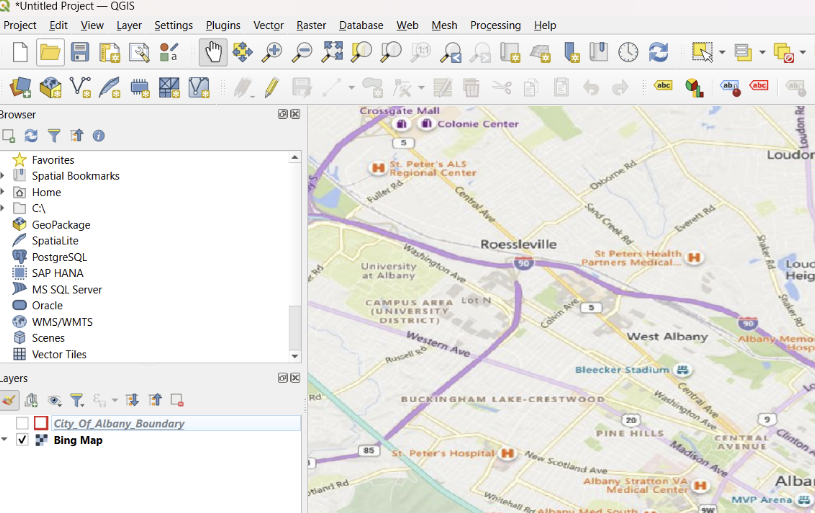
- From here you can add a basemap to your map window. E.g. Go to Web > Quick Map Services > Bing > Bing Map and you’ll see this:
We will use the file CrimesWithXY_ForVisualization.csv in our test (download above). This is a file of 74,237 incident records for which we can find a location. The records are not filtered any other way.
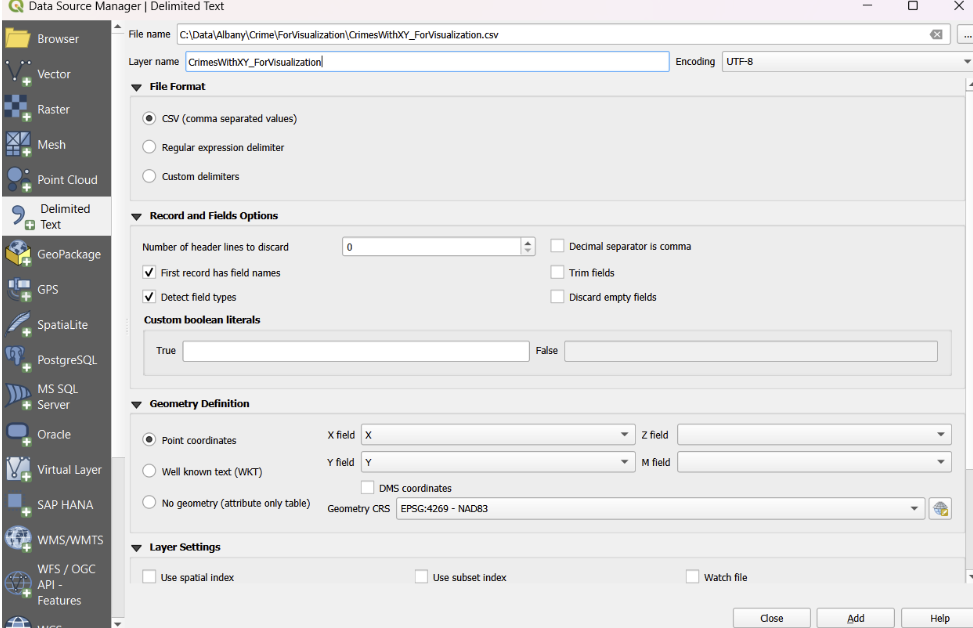
In QGIS go to Layer > Add Layer > Add Delimited Text Layer and choose the File Name for CrimesWithXY_ForVisualization.csv. QGIS scans the file and should automatically figure out the details - it will know that the first records has field names, it will see that there are two columns (X and Y) that contain the definition of the point geometry. If it does not guess the Geometry CRS as “EPSG:4269 - NAD83) you’ll have to select that.
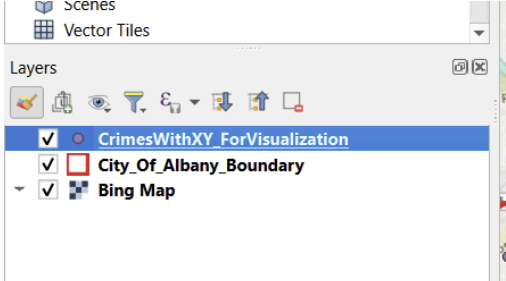
When you click “Add” you’ll see the data displayed on the map, on top of the Bing map layer. Also I have a City_of_albany_boundary file that you can add to the map if you want.
Creating a heatmap follows this document - https://www.qgistutorials.com/en/docs/3/creating_heatmaps.html
Select the CrimesWithXY_ForVisualization layer and hit the Open Layer Styling Panel button
Choose Heatmap
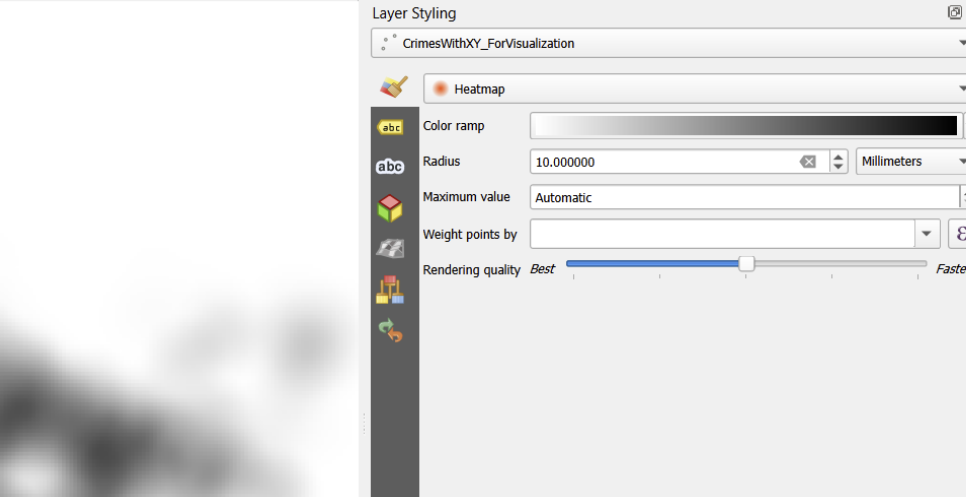
One of the first things that I would is change the color ramp and the opacity.
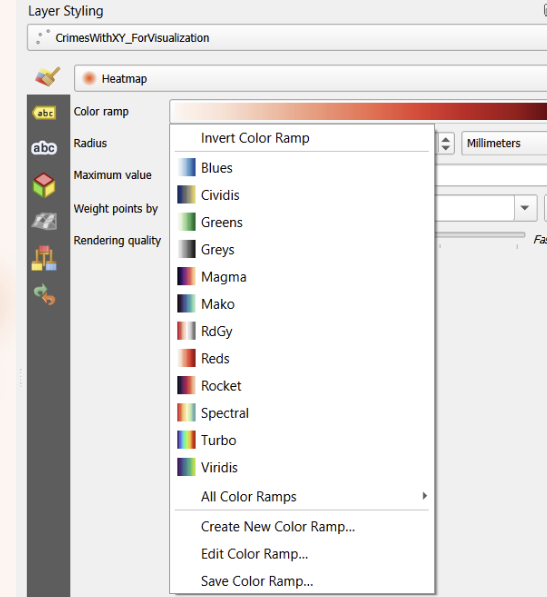
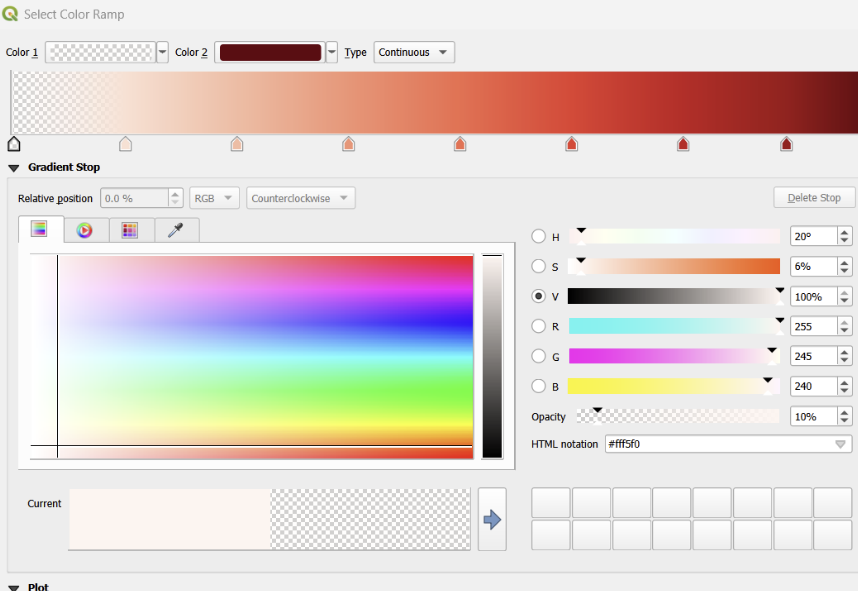
Click on the arrow to the right of Color ramp, choose “Red” and then click the “Edit COlor Ramp” option
Change the opacity to 10% or a low value
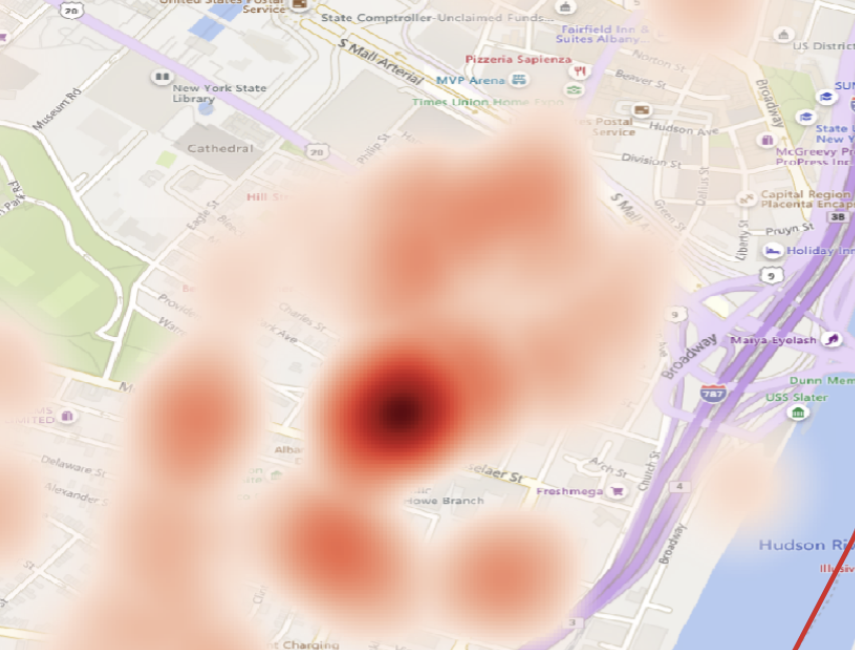
You can start to see some of the hot spots pop out.
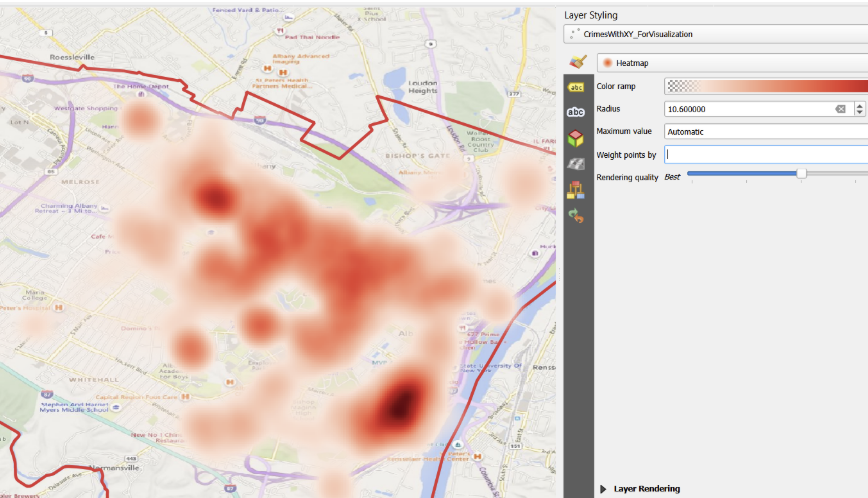
You can zoom around and play with different values, and with each tweak you’ll see the heatmap gets re-rendered'
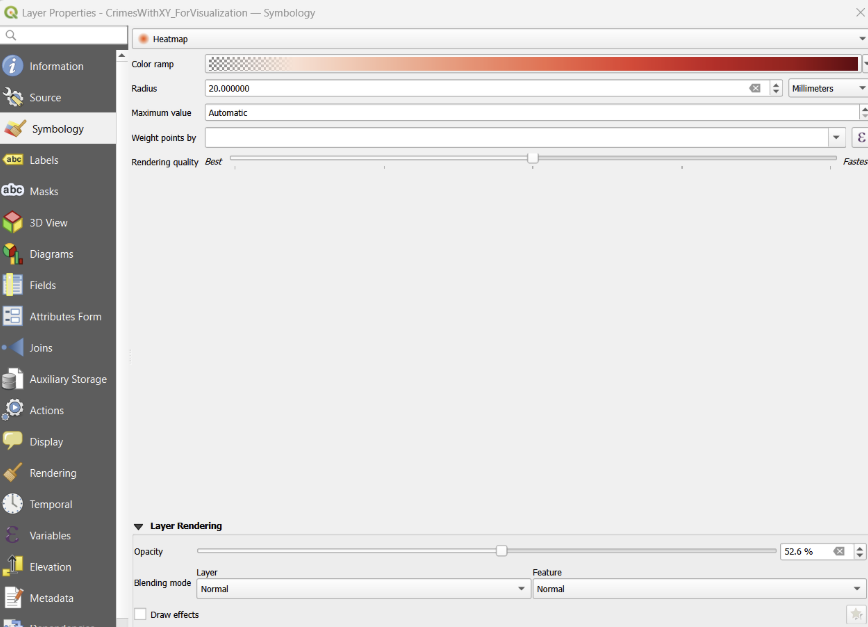
There is another opacity setting - if you double click on the “CrimesWithXY_ForVisualization” layer in the “Layers” box it will bring up properties. You can go to Symbology and at the bottom under Layer Rendering change Opacity to 50% or thereabouts
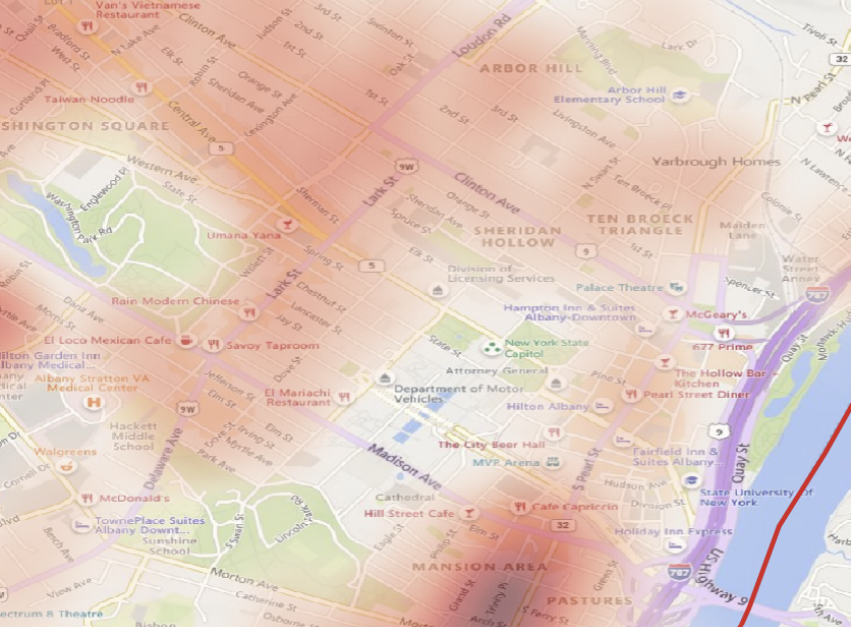
And you can get a better view of the underlying map
The QGIS documentation has another example of how to use a crime dataset and has other ideas on how to weight the different types of crime - see the link.
