Albany, New York RooftopSolar
This article is in draft mode, awaiting finalization. Article is available for review & comments.
How much solar energy production occurs in Albany?
Is the rate of solar energy panel installation going up or down?
Who are the vendors and what does it cost?
Where is solar being installed?
How much Residential and Commercial Solar production happens in Albany?
Recently we FOILed 6 years of building permit data from the City of Albany and received the data from Albany’s Buildings & Regulatory Compliance Department (thank you!). The building permit data is a part of a larger study we are doing to answer the question “how many new housing units have been constructed in Albany in the last 5 years?” While we’re working on that question we’ve also been gathering other insight from the building permit data which led us to the questions about solar above.
There currently is no up-to-date public data on solar installations that we have found. The Census Bureau is testing solar energy production questions, however these questions have not been added to the Census Bureau’s American Community Survey.
Using building permit data to understand solar installations is a bit of an experiment - can we meaningfully understand solar installations using this data?
Summarizing our findings:
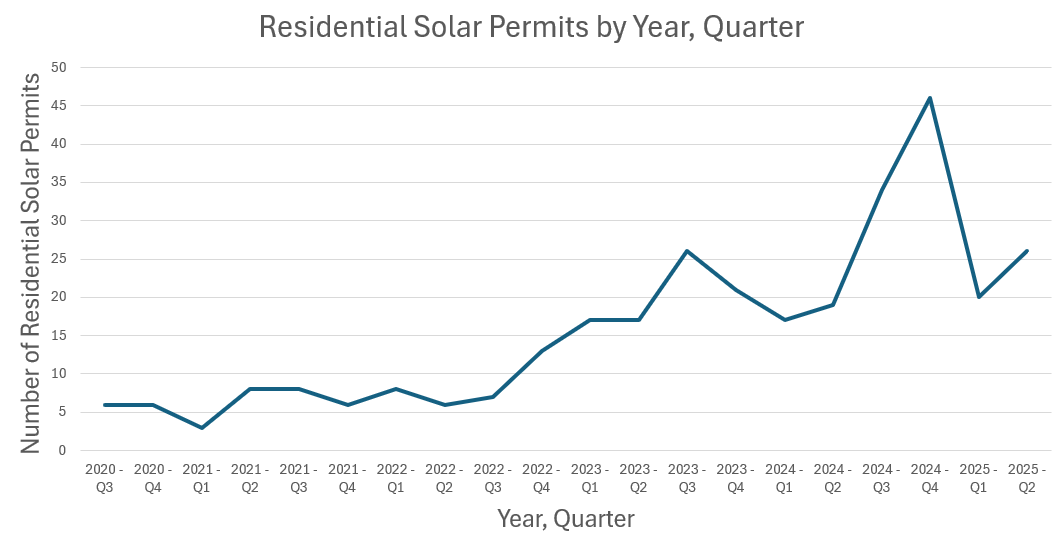
- Solar installations in the City of Albany continue to grow year-over-year, with a late 2024 spike
- Newly installed (2020-2025) solar power generation in the City of Albany is equal to the power consumption of 300-450 households
- Solar installation is not evenly distributed across the City of Albany and is most commonly found south of New Scotland Ave and west of Manning Blvd
Building Permit Data
We received a file of nearly 25,000 building permits covering 2018 through the end of June 2025. The building permit data for 2018 and 2019 was sparse so we left that data out of the study and only analyzed 2020 through 2025. We recognize that our study won’t capture solar that predates 2020.
A building permit record looks like this. A property and an address, a permit date, the company doing the work, the cost of the work, details of the work and the property type (Commercial, Residential or Other). The City of Albany has a Permit Work Class with “Solar Panels” as one of the values which lets us extract data on solar installations. Note that we have removed the house numbers in this example>.
| Permit Number | BLDG22-36491 | BLDG22-36558 |
| Parcel Number | 75.67-1-2 | 41.00-2-21 |
| Address | <address on EDGECOMB ST> | <address on 210 WASHINGTON AVE EXT> |
| Permit Issue Date | 7/27/2022 | 7/27/2022 |
| Original Company Name | New York State Solar Farm | AEC Solar Energy Corp. |
| Total Cost of Work | $15,625.00 | $20,400.00 |
| Permit Fee | $185.00 | $221.00 |
| Permit Work Class | Solar Panels | Solar Panels |
| Permitted Work | PV Solar install - Roof mounted System
(14) Sunpower SPR-M425-H-AC System Size: 5.95 kW DC |
SOLAR PANELS |
| Property Type | Residential | Commercial |
Note that about ⅔ of the time the permit indicates what the size of the installation is (in Kilowatts, kW). For example, the Edgecomb St installation is 5.95 kW.
For the purpose of this analysis we are studying all building permits, and we are assuming that all solar projects have or will come to completion.
In the study period, 2020-2025, there were 305 solar installations with a Total Cost of Work over $7 million.
| Property Type | Number of Installations | Work Cost |
|---|---|---|
| Residential | 292 | $4,867,291 |
| Commercial | 12 | $1,834,220 |
| Other | 1 | $341,333 |
| Total | 305 | $7,042,845 |
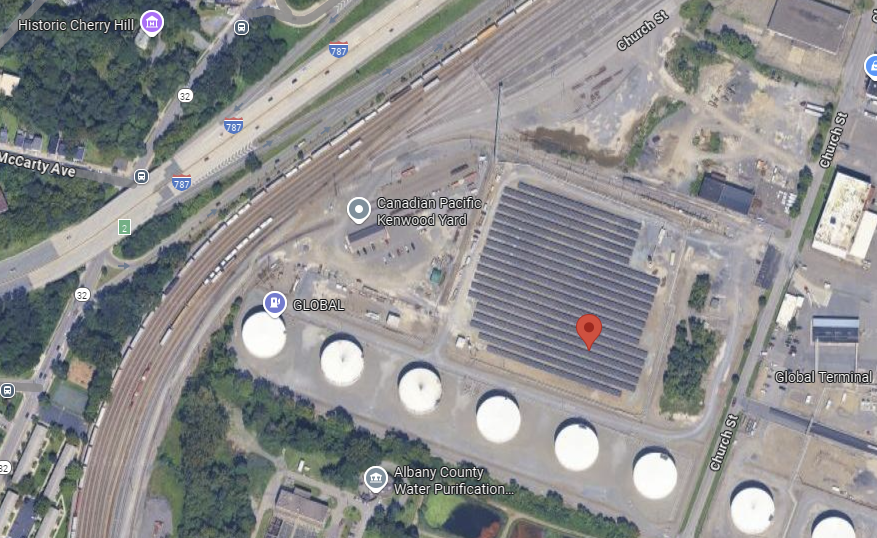
The “Other” is a 2500 kW, $341k ground solar installation at the Port of Albany. To give perspective on the size, most Residential installations are between 5-15 kW. For the remainder of this analysis we will set aside this installation from our calculations as it is an outlier; there are no other ground solar installations in the queue within the City.
Filling in the Data Gaps
It was important for us to get a sense of the overall power generation for all solar installations. ⅓ of the building permits did not come with a power generation sizing (e.g. 4.10 kW) in the Permitted Work description. We ended up filling in the blanks with a model; we used the Total Project Cost per kW for solar installations where the kW was listed and developed a vendor-by-vendor cost/kW. We then filled in the kW of any project where we knew the vendor, and we knew the total project cost, but we didn’t know the kW.
What was surprising was the significant difference in cost/kW by vendor. This table details the 5 vendors who ran the most solar projects in the last 5 years.
| Vendor | Cost / kW | Installations |
|---|---|---|
| PlugPV | 1,318 | 127 |
| Kasselman Solar | 3,265 | 63 |
| Infinity Solar Systems | 2,192 | 26 |
| Empire Solar | 1,502 | 18 |
| AEC Solar Energy Corp. | 2,364 | 12 |
It is possible that there are variables to the total project cost that we aren’t aware of that influence the vendor-specific cost; for example, certain vendors may use higher quality equipment, or work on more complex installations that add to the cost, or otherwise have different cost. Net - don’t use this table to determine who is most and least expensive, use this table to understand that there appear to be meaningful cost differences between vendors, so ask questions.
Data Analysis
Once we established a model to understand or predict the kW size of every project, either through the building permit data or through a model, it was time for some analysis. We went back to our questions:
How is the rate of solar installations changing?
We looked at residential solar permitting, by quarter, from 2020 through 2025. Industry trade groups reported a nationwide decline of residential installation in 2024, however solar permits did spike in the City of Albany in 2024, accompanying overall growth in 2024. We suspect (but have no data to prove) that the Q4 2024 spike in installations is a combination of interest plus short-term decisions driven by medium-term uncertainty over Federal solar incentives.
Who is installing the residential solar systems?
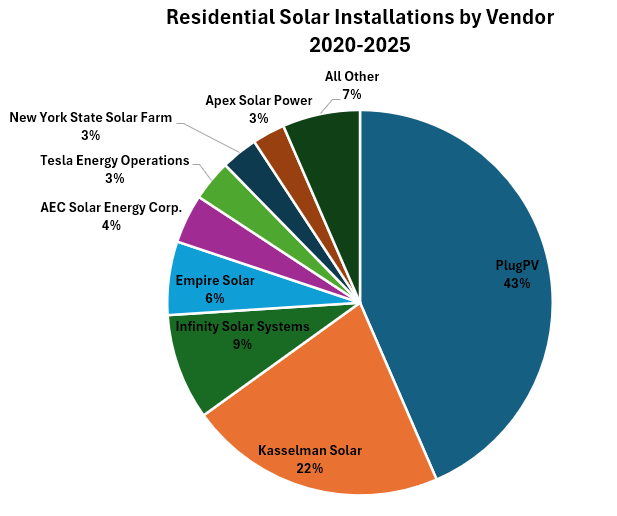
PlugPV and Kasselman are the leaders in installation with 6 other vendors having meaningful installation volume.
What is the sum of power being generated from solar installations?
Between residential and commercial installations from 2020-2025 the total systems represent over 3,000kW of generation. As a reminder, when we use “Total Cost” below that is the Total Cost of the work found on each building permit.
| Property Type | Number of Installations | Work Cost | Total kW | Total Work Cost / kW |
|---|---|---|---|---|
| Residential | 292 | $4,867,291 | 2,392 | 2,035 |
| Commercial | 12 | $1,834,220 | 632 | 2,903 |
| Total | 304 | $6,701,511 | 3,023 |
How many housing units could be powered by the newly installed solar generation?
Given all of the solar generation installed in the City of Albany we want to estimate how much electricity production happens and then determine how many households this electricity would power.
A typical solar installation will generate between 800-1,500 kilowatt-hours (kWh) per kW per year, depending upon weather, installation location, and tree cover. For example, a 5 kW system should generate between 4,000 and 7,500 kWh of electricity per year.
The average household consumes between 6,000-14,000 kWh of electricity per year, with the actual consumption varying based on single family home vs. apartment, gas vs. electric hot waters and heating, size of household and other factors.
In our estimation below we will assume that each kW of capacity generates 1,200 kWh of electricity per year, and each household consumes 9,000 kWh of electricity per year on average.
Solar Power generation in Total Number of Housing Units =
= (total size of Albany solar systems, in kW * average electricity production in kWh per kW) / average electricity consumption per housing unit in kWh
= (3,023 * 1,200) / 9,000
Solar Power generation in Total Number of Housing Units = 403
Tuning any of the assumptions can change the solar power generation output. The total amount of solar-produced electricity could range between 2.5 to 4 million kWh. Given this, a reasonable range for the newly installed solar power generation is between 300-450 housing units of yearly electric power generation.
Where are solar installations occurring?
We mapped the solar installation building permits. In this map the green dots are residential installations; the purple dots are commercial installations.
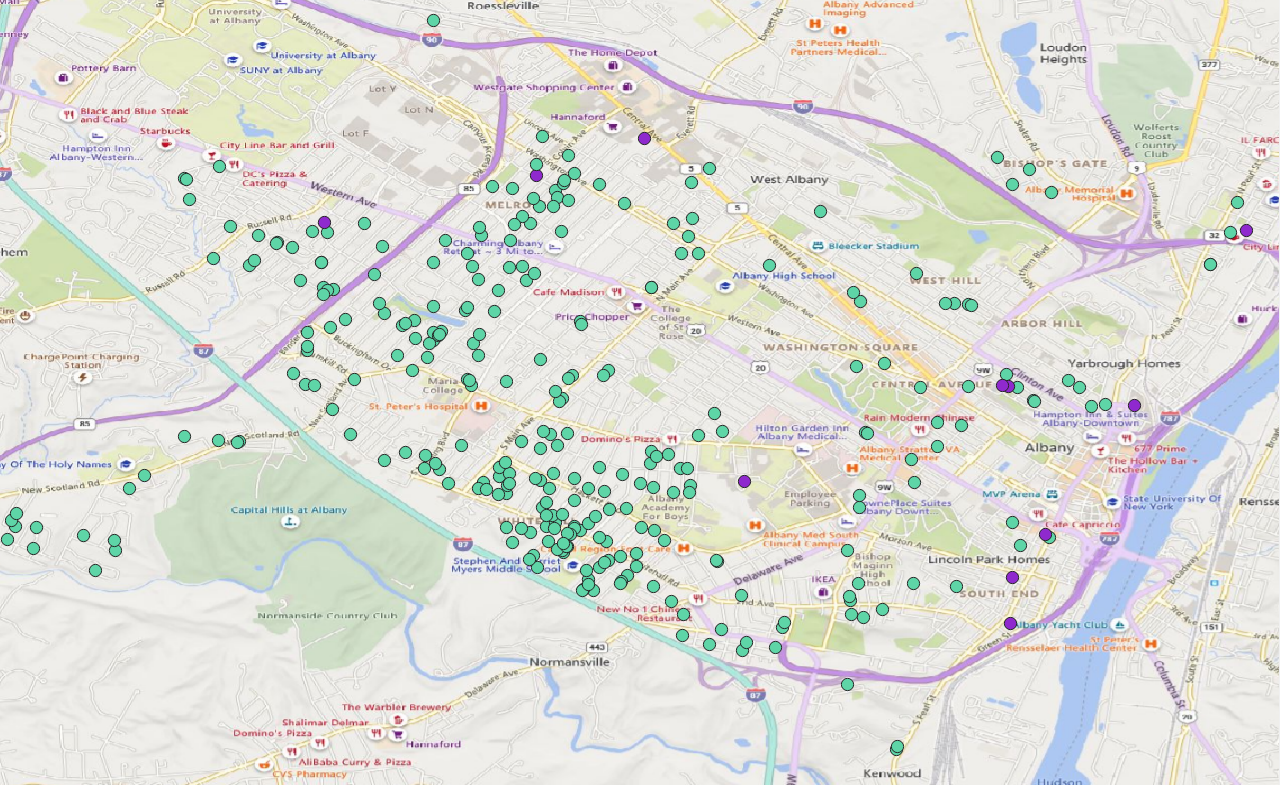
Solar installations are not evenly distributed across the City of Albany. Two areas capture most installations - 1) south of New Scotland Ave (the Whitehall and Helderberg neighborhoods) and 2) west of Manning Blvd (Buckingham Pond and Melrose neighborhoods).
We suspect that we do not see meaningful installations in the remainder of the city for various factors including:
- The Federal Residential Clean Energy Credit is not available to landlords or property owners who don't live in their homes.
- Slate roofs
- Rental buildings vs. owner-occupied buildings changes the motivations and interest in a longer-term investment such as solar
- Smaller lots, smaller roofs, more tree cover
Summary
Going back to our questions at the beginning…
How much solar energy production occurs in Albany?
Of recently installed (2020-2025) solar energy installations, 300+ installations are powering the electricity needs of between 300-450 housing units.
Is the rate of solar energy panel installation going up or down?
Installations trended higher in 2024 and at the beginning of 2025. We will need to look at a full year of 2025 installations to determine if this trend continues.
Who are the vendors and what does it cost?
Over 15 different vendors have installed solar systems in Albany, with PlugPV and Kasselman Solar as the leading vendors. Total project costs vary by vendor with most vendors ranging between $2000-3500/kW.
Where is solar being installed?
Not in an even distribution across Albany; most installation is in the southwest and western parts of the city.
How does Albany’s solar production compare against other green energy production?
We added this additional question along the way.
For perspective, a 5 Megawatt (MW) wind turbine can produce between 10-20 million kWh of power depending upon its siting. A 5MW onshore wind turbine typically costs between $7.5-12.5 million. This yields a cost per MW of $1.5-2.5 million/MW of capacity.
The City of Albany’s solar cost/MW, using Total Work Cost, is approximately $2.2 million/MW of capacity. This is a price/output figure that is generally competitive with equivalent wind production.
Future Analysis
As we looked at these focused questions about 2020-2025 solar installation in the City of Albany we put a number of questions in a parking lot for future analysis:
- We want to update this story in early 2026 so that we can see what the trendline looks like, given various changes and potential changes in Federal and NY State incentive programs. We mentioned some potential reasons for the Q4 2024 spike in installations and we would want to see if this is replicated in 2025 or not.
- We want to connect the solar installation data to housing characteristics and home ownership data - does solar primarily get installed in particular scenarios?
- We would want to analyze the solar installation in another community to see if the trends and patterns are similar to the City of Albany?
- Lastly, we are interested in acquiring and understanding data that comes from the NY State solar incentive programs - what can we learn from the data statewide?
Data
Process
No significant data processing was required to analyze the data in Excel
Credits
This data story and its content is available under the Creative Commons Attribution license.
Persons or organizations that Share or Adapt this content should provide Attribution that provides appropriate credit, which includes:
- © Copyright 2025
- Tyche Insights, P.B.C.
- KarlTyche (Karl Urich)
For example, a data product or service that utilizes this article could include attribution such as:
"Portions derived from 'Albany NY Rooftop Solar', © Copyright 2025 by Tyche Insights, P.B.C., KarlTyche (Karl Urich) & licensed under the CC BY 4.0 license"