Albany, New York Police Complaints
Article published February, 2025.
What Insight is in the Albany Police Department's Complaints Data?
The Albany Police Department (APD) publishes many statistics and visualizations on openAlbany, more than half of all listings originate from the APD and they represent the most current data found on openAlbany.
There are several datasets related to citizen complaints and we wanted to explore those datasets to understand what we can learn. The APD posts a data file of all citizen complaints dating back to 2009 (there is some additional data from prior years but it is not significant). In addition, there is a month-by-month visualization here.

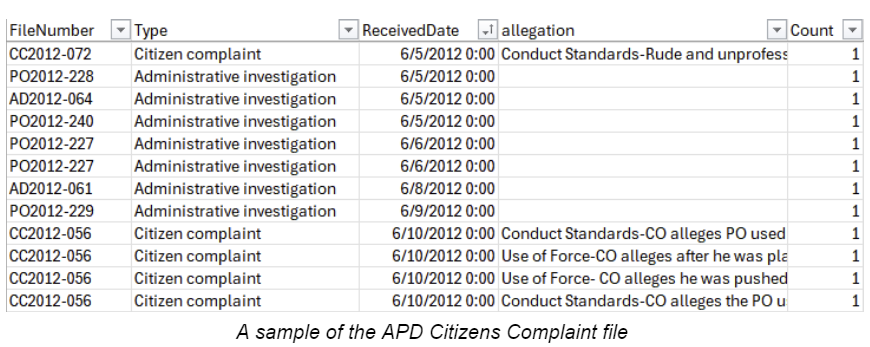
We downloaded the citizen complaint data file and began exploring it. The data is very straightforward. There are 5 columns of data - a case number, a type of complaint, a date, and allegation and a count (which is always=1). There are two values for “Type”: Citizen Complaints are initiated by the public and Administrative Investigations are generated within the Police Department.
Analysis by Year
We did a small amount of cleaning, deleting any records prior to 2009 and some other invalid data.
This left 7,223 complaints recorded between 2009-2024. We can view complaints by year, including both citizen complaints and internal administrative investigations.
| Year | Number of Complaints |
|---|---|
| 2009 | 844 |
| 2010 | 845 |
| 2011 | 765 |
| 2012 | 818 |
| 2013 | 659 |
| 2014 | 639 |
| 2015 | 485 |
| 2016 | 317 |
| 2017 | 233 |
| 2018 | 198 |
| 2019 | 254 |
| 2020 | 217 |
| 2021 | 286 |
| 2022 | 315 |
| 2023 | 239 |
| 2024 | 109 |
2010 had the highest number of complaints (845) and 2018 is the full year with the lowest number of complaints (198). Note that 2024 includes only 9 months of complaints data.
All Complaints by Quarter
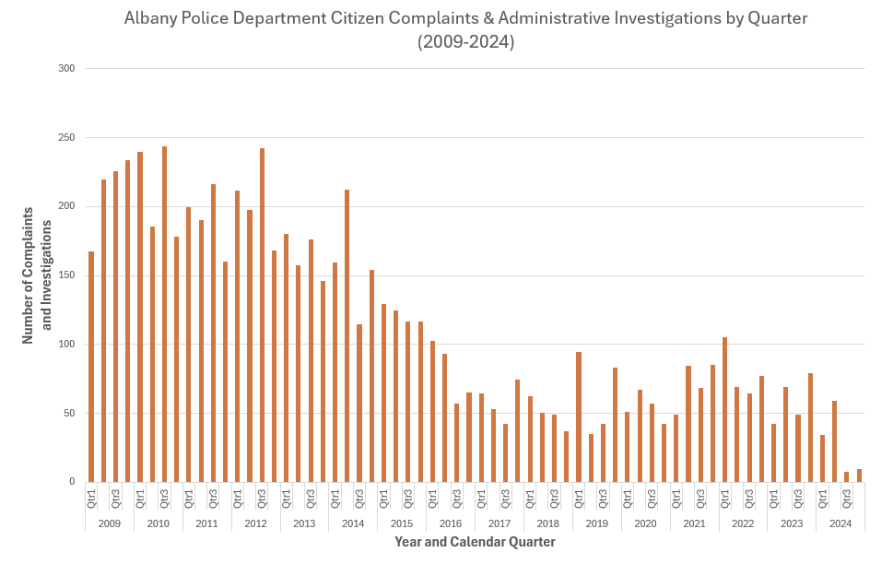
We started to graph out the data for 2009-2024 regardless of type of complaint. We wanted to avoid the lumpiness of month-to-month analysis so we chose to analyze by year & quarter. For example, in the graph below for Q3 2009 (the months July-September 2009) there were 225 citizen complaints (the third bar from the left).

Between the graph and the yearly statistics table above, the data suggests a drop in overall complaints, with a dramatic drop between 2012 to 2018.
Administrative Investigations by Quarter
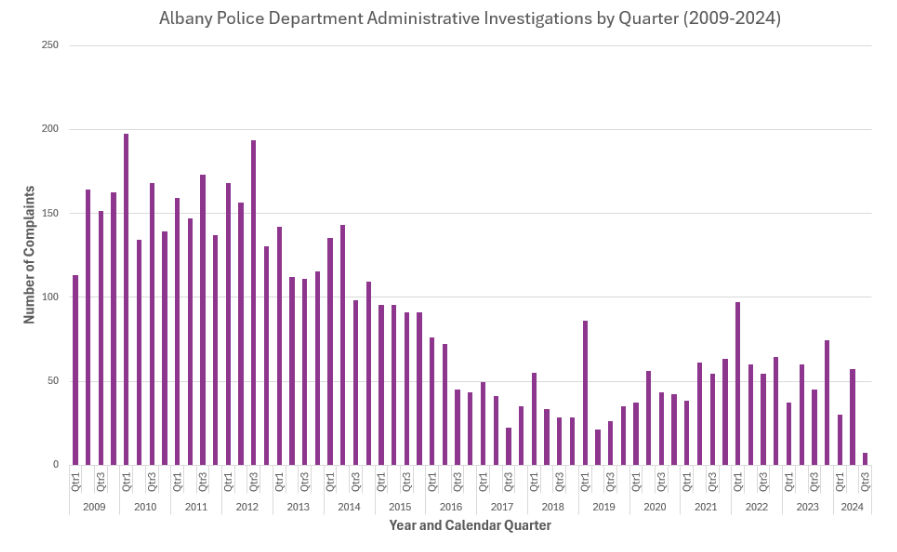
We wanted to pull apart the two types of complaints - Citizen Complaints and Administrative Investigations. We started graphing Administrative Investigations which you will recall are generated internal to the Police Department.

Graphing the number of Administrative Investigations by quarter shows a trend similar to that of all complaints.
Citizen Complaints by Quarter
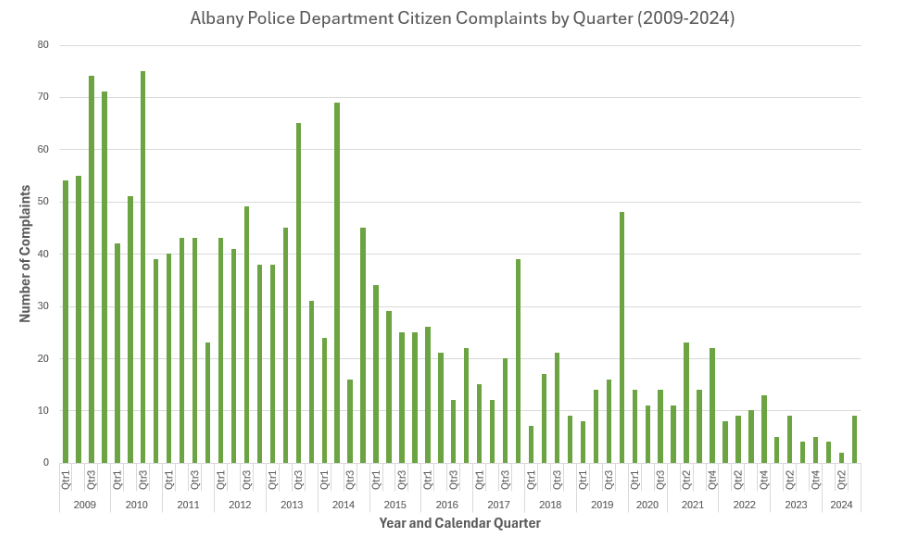
Lastly, we graphed Citizen Complaints (issues initiated by the public). We generally see the same trends as the previous graphs, however there are more spikes or surges in citizen reports.

For example, in 2014 the reports by quarter are:
- Q1 (January to March) - 24 citizen complaints
- Q2 (April to June) - 69 citizen complaints
- Q3 (July to September) - 16 citizen complaints
- Q4 (October to December) - 45 citizen complaints
Observations on Complaints Data
Looking at the trends there are a number of things that could be going on. Three possibilities are 1) complaints are decreasing, 2) police force training is having an impact, and/or 3) processes to self-report data are not being utilized as frequently since the system’s inception. However there is nothing in this data that suggests what the root cause is (or causes are) for a decrease in overall complaints; is it a mix of those three possibilities or is something else going on?
Analyzing Allegations Coding
In an effort to better understand the data and identify additional trends we analyzed the “Allegations”. The “Allegations” field provides additional detail on the complaint or issue.
We only looked at the Allegations data between 2020-2024; prior Allegations data was frequently freeform (e.g. “CO alleges that the officer put handcuffs on him and tightened them for over a period of 45 minutes”) and not specifically categorized.
| Allegation | Count of Allegation |
|---|---|
| Arrest Authority and Procedures | 2 |
| Biased Base Policiing | 4 |
| Call Handling | 8 |
| Conduct Standards | 14 |
| Department Equipment | 6 |
| Off Duty Conduct | 22 |
| Rudeness | 1 |
| Use of Force | 2 |
| Vehicle Operations | 2 |
Looking at just the Administrative investigations between 2020-2024 there were 979 Administrative investigations. 64 of the Administrative investigations (7%) were coded with an Allegation; the remaining 93% of Administrative investigations were blank (not coded). We can review the coding of the Administrative investigation Allegations in the table below. “Off Duty Conduct” was the most frequent Allegation value.
| Allegation | Count of Allegation |
|---|---|
| Arrest Authority and Procedures | 4 |
| Call Handling | 22 |
| Conduct Standards | 12 |
| Department Equipment | 1 |
| Prisoner Property | 2 |
| Rudeness | 1 |
| Use of Force | 6 |
| Vehicle Operations | 2 |
Reviewing the Citizen Complaints between 2020-2024 there were 187 Citizen Complaints. 50 of the Citizen Complaints (27%) were coded with an Allegation; the remaining 73% of Citizen Complaints were blank (not coded).
Recommendations
The Albany Police Department is the most active department on openAlbany and should be recognized for the frequency of their open data posts. Unfortunately, there are some limitations in the usefulness of the Complaints data that APD is posting. We have several recommendations that will increase the utility of the Complaints data:
- Allegation coding definitions - the data should be published with a glossary that defines the Allegation codes, i.e. when is “Rudeness” used, what is “Call Handling” and how is that different from “Arrest Authority and Procedures”
- Allegation coding comprehensiveness - 100% of all Citizen Complaints and Administrative Investigations should be coded with an Allegation, or reasons should be provided when an issue is not coded. In addition, the APD should be clear about how multiple complaint issues are handled, e.g. if an internal investigation reveals an issue that transcends Use of Force and Vehicle Operations how is that handled?
- The APD should construct a narrative - ideally quarterly, at the least yearly - that comments on the trends. This narrative should describe any cause and effect that could be driving trends (e.g. “we instituted ABC training which resulted in XY showing up in the data”)
- The APD should review and specifically comment on the efficacy and comprehensiveness of self-reporting. Importantly, when we see a drop in issues (which should be a good thing), we want to ensure that the drop is not an artifact of gaps in self-reporting.
Data
As noted earlier in the document, the data source is the Albany open data website.
Process
No significant data processing was required, other than importing the data into XLS.
Credits
This data story and its content is available under the Creative Commons Attribution license.
Persons or organizations that Share or Adapt this content should provide Attribution that provides appropriate credit, which includes:
- © Copyright 2025
- Tyche Insights, P.B.C.
- KarlTyche (Karl Urich)
For example, a data product or service that utilizes this article could include attribution such as:
"Portions derived from 'Albany NY Police Complaints', © Copyright 2025 by Tyche Insights, P.B.C., KarlTyche (Karl Urich) & licensed under the CC BY 4.0 license"