Albany, New York Housing
Article published March, 2025.

How does Albany's housing compare against neighbors?
One of the demographic dimensions we have spent a lot of time researching is Housing. Any discussion of housing benefits from using comparisons. If we say “Albany’s housing vacancy rate is 15% and 59% of all owner-occupied houses are valued between $150-300k” that may mean little. However, if we show comparable data for neighboring cities that helps the understandability of the data.
Data and Comparisons
In this article we will use 2020 US Census housing and occupancy data to compare and contrast Albany, Schenectady, Troy, the Village of Colonie and the City of Saratoga Springs.

We will use the Census data to examine and compare housing data in 6 dimensions - occupancy, # of units, year built, owner- and renter-occupied, value, and gross rent costs. We will make sure to define the terms using Census Bureau definitions.
Occupancy
“A housing unit is occupied if a person or group of persons is living in it at the time of the interview or if the occupants are only temporarily absent, as for example, on vacation. The persons living in the unit must consider it their usual place of residence or have no usual place of residence elsewhere.”
| HOUSING OCCUPANCY | Albany | Schenectady | Troy | Colonie | Saratoga |
|---|---|---|---|---|---|
| Total housing units | 48,665 | 31,819 | 23,794 | 2,989 | 14,357 |
| Occupied housing units | 85.5% | 77.4% | 85.0% | 95.7% | 87.4% |
| Vacant housing units | 14.5% | 22.6% | 15.0% | 4.3% | 12.6% |
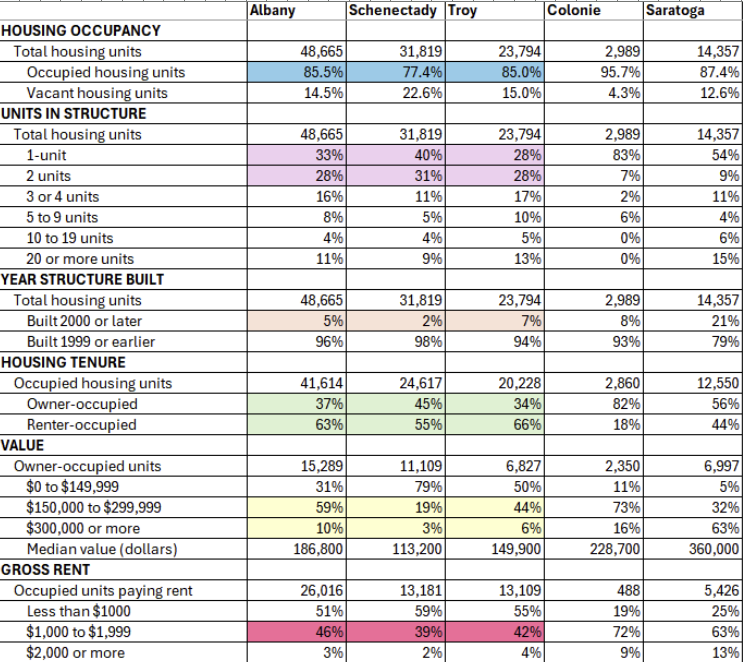
Nationwide occupancy rates are typically around 90-91%; Albany’s 85.5% occupancy rate is concerning. Every percentage point of Albany’s occupancy/vacancy rate is nearly 500 housing units. To achieve a 90% occupancy rate would require 4500 more occupied housing units; at approximately 2 people per household in Albany that would imply approximately 9000 more residents. This increased population would be a boon to Albany, in aggregate.
Albany’s occupancy rate is equal to Troy’s, much higher than Schenectady’s and much lower than Colonie’s. Saratoga’s lower occupancy rate may be a function of development or a community with a significant number of second homes.
Units in Structure
“The number of housing units in a building, including both occupied and vacant units. A structure is a separate building that has open space on all sides or is separated from other structures by dividing walls. In apartment developments, each building with open space on all sides is considered a separate structure.”
| UNITS IN STRUCTURE | Albany | Schenectady | Troy | Colonie | Saratoga |
|---|---|---|---|---|---|
| Total housing units | 48,665 | 31,819 | 23,794 | 2,989 | 14,357 |
| 1-unit | 33% | 40% | 28% | 83% | 54% |
| 2 units | 28% | 31% | 28% | 7% | 9% |
| 3 or 4 units | 16% | 11% | 17% | 2% | 11% |
| 5 to 9 units | 8% | 5% | 10% | 6% | 4% |
| 10 to 19 units | 4% | 4% | 5% | 0% | 6% |
| 20 or more units | 11% | 9% | 13% | 0% | 15% |
3/5th of Albany’s housing units are one or two unit. 10% of Albany’s housing units are in 20+ unit structures. Drive around the city and you see two unit flats and multi-dwelling units and this is not a surprise. Albany and Troy are exceptionally similar in the percentages of housing units for each housing unit type. Schenectady has a bias towards 1- and 2-unit structures.
Colonie is a single family home community, where 5/6th of all housing units are 1-unit. Saratoga has seen significant growth in multi-dwelling units (MDU), both for primary and secondary residences, and households stepping down from single family homes to apartment living. 1/4th of Saratoga’s housing units are in buildings with 5 or more units.
Year Structure Built
“Year Structure Built refers to the date a structure was first built, not any later changes.”
| YEAR STRUCTURE BUILT | Albany | Schenectady | Troy | Colonie | Saratoga |
|---|---|---|---|---|---|
| Total housing units | 48,665 | 31,819 | 23,794 | 2,989 | 14,357 |
| Built 2000 or later | 5% | 2% | 7% | 8% | 21% |
| Built 1999 or earlier | 96% | 98% | 94% | 93% | 79% |
5% of Albany’s housing units have been built since 2000. In later analysis we want to break this down to understand the balance between new MDU units and single family homes; it is likely the former, however this requires research. Troy and Colonie have higher percentages of newer constructed housing units, Schenectady newer construction is significantly lower than Albany’s.
Housing Tenure
“Occupied housing units are split into two categories: renter-occupied and owner-occupied. This distinction is known as “tenure” (think “tenant”).”
| HOUSING TENURE | Albany | Schenectady | Troy | Colonie | Saratoga |
|---|---|---|---|---|---|
| Occupied housing units | 41,614 | 24,617 | 20,228 | 2,860 | 12,550 |
| Owner-occupied | 37% | 45% | 34% | 82% | 56% |
| Renter-occupied | 63% | 55% | 66% | 18% | 44% |
A little more than ⅓ of Albany’s housing units are owner-occupied. This number is about what you would expect with our general demographics, apartment complexes, student population, institutional housing and low income housing.
Value of Owner-Occupied Housing
“The Census Bureau determines "value" primarily by asking individuals directly about the market value of their property (like a home) through surveys”
| VALUE | Albany | Schenectady | Troy | Colonie | Saratoga |
|---|---|---|---|---|---|
| Owner-occupied units | 15,289 | 11,109 | 6,827 | 2,350 | 6,997 |
| $0 to $149,999 | 31% | 79% | 50% | 11% | 5% |
| $150,000 to $299,999 | 59% | 19% | 44% | 73% | 32% |
| $300,000 or more | 10% | 3% | 6% | 16% | 63% |
| Median value (dollars) | 186,800 | 113,200 | 149,900 | 228,700 | 360,000 |
This is a very interesting story. Relative to our peers (Schenectady and Troy) Albany has the highest share of $150k+ housing values (79% of owner-occupied housing units in Albany vs 22% and 50% in our peers). . Property values are a function of the characteristics of the property and dwelling unit AND the environment surrounding the property and we can credibly say that our property values are driven by good housing stock and the general goodness of the surrounding environment.
Gross Rent
“Gross rent is the monthly amount of rent plus the estimated average monthly cost of utilities (electricity, gas, water and sewer) and fuels (oil, coal, kerosene, wood, etc.)”
| GROSS RENT | Albany | Schenectady | Troy | Colonie | Saratoga |
|---|---|---|---|---|---|
| Occupied units paying rent | 26,016 | 13,181 | 13,109 | 488 | 5,426 |
| Less than $1000 | 51% | 59% | 55% | 19% | 25% |
| $1,000 to $1,999 | 46% | 39% | 42% | 72% | 63% |
| $2,000 or more | 3% | 2% | 4% | 9% | 13% |
Yes, the obvious joke - rent is gross. The percentage of Albany’s properties with gross rents under $2000/month are similar to both Schenectady and Troy. Note the significant difference between Albany rents and Colonie/Saratoga.
Summary and Future Research
As we looked at Albany’s housing, contrasting against 4 neighbors using 6 dimensions, a number of statistics surprised us - Albany’s high vacancy rate and Albany’s relative high percentage of $150k+ and $300k+ housing stock were two such numbers.
In the future we want to look at topics such as:
- Housing differences across neighborhoods
- The intersection of Albany’s Vacant Housing program and vacant housing rates
- New construction and the growth of housing units (note that we will touch on multi dwelling unit construction in an article about Albany’s Affordable and Inclusionary Housing program)
Data
See Data and Comparisons section
Process
No significant data enrichment or cleaning processes.
Credits
This data story and its content is available under the Creative Commons Attribution license.
Persons or organizations that Share or Adapt this content should provide Attribution that provides appropriate credit, which includes:
- © Copyright 2025
- Tyche Insights, P.B.C.
- KarlTyche (Karl Urich)
For example, a data product or service that utilizes this article could include attribution such as:
"Portions derived from 'Albany NY Housing', © Copyright 2025 by Tyche Insights, P.B.C., KarlTyche (Karl Urich) & licensed under the CC BY 4.0 license"